The optical coherence tomography (OCT) method allows intravital visualization of the structures of the eye in a cross section. The resolution of this technique is very high, so it is compared in terms of information content with morphological research (using a microscope). OCT is based on the principle of low-coherence interferometry.
Optical coherence tomography shows the magnitude and depth of penetration of a light signal that is reflected from body tissues that differ in optical properties. The axial resolution of OCT is about 10 µm, which is the best of all existing methods for studying biological structures. Optical coherence tomography determines the echo delay of the light wave reflected from the tissue. This involves measuring the depth and intensity of the signal. When focusing on tissues, the light beam is scattered and partially reflected from the microstructures of the tissues under study at different levels.
This mechanism is similar to the principle used in A-scan ultrasound, which measures the travel time of an acoustic wave from the source to the tissue and back to the sensing device. Optical coherence tomography uses not a sound wave, but a beam of coherent light in the infrared range (820 nm).
The diagram of the OCT device used in ophthalmological practice is as follows. The light beam source is represented by a superluminescent diode, the coherence length of which is 5-20 microns. The Michelson interferomer is located in the hardware part of the device, the confocal microscope (slit lamp or fundus camera) is located in the object arm, and the time modulation unit is in the reference arm. Using a video camera, the scanning trajectory and the overall picture are displayed on the monitor. To process the obtained values, a computer is used, which presents the data in the form of graphic files. Tomograms initially look like black and white logarithmic scales. To make the resulting paintings easier to perceive, they are converted to pseudo-color, which uses black for optical transparency and red/white for areas with a high degree of light reflection.
Application area
Modern optical coherence tomography is a non-contact and non-invasive technique that is used in ophthalmological practice to study the morphological structures of the anterior and posterior segments of the eye in living patients. This technique allows not only to identify, but also to quantify and record the indicators of the retina and optic nerve. In this case, the thickness is measured and the transparency of the cornea is determined, and the structure of the iris is examined. OCT can be repeated many times, and the results are stored in the computer memory, which is convenient for assessing the course of the pathological process.
Indications
Optical coherence tomography is performed to obtain information about all structures of the eye, both normal and pathological.
Using OCT, many ophthalmological diseases can be diagnosed:
- glaucoma
- iridociliary dystrophy
- changes after refractive surgery
- macular holes and pre-lacerations
- traction vitreoretinal syndrome
- swelling and degeneration of the macula
- retinitis pigmentosa
In what cases is the procedure indicated?
A retinal CT scan is performed in case of suspicion or in case of the presence of diseases such as:
- retinal dystrophy;
- macular degeneration;
- glaucoma;
- retinitis pigmentosa;
- diseases of the optic nerve, cornea;
- macular edema;
- thrombosis;
- diabetes;
- tumor;
- aneurysm rupture.
If there are complaints of decreased vision and pain in the eyes, it is recommended that the patient undergo OCT of the eye.
In addition, patients undergo such a study in case of ruptures, retinal detachment, before or after surgery, and in case of corneal opacities of unknown origin.
The procedure is also performed if the patient complains of certain symptoms. This may be the appearance of spots before the eyes, pain in the organ, decreased visual acuity or its sudden disappearance.
Methodology and aftercare
The technical aspects of OCT include the following steps. First, the patient's data is entered and the examination begins. In this case, the patient is asked to fix his gaze on a flickering object (in the lens of the fundus camera). Next, the camera is gradually brought closer to the eye until the image of the retina on the monitor becomes clear. The doctor fixes the camera at this distance using a special button and additionally adjusts the sharpness of the image. If visual acuity is low (when the patient cannot see a flickering object), external illumination should be used, and the patient should look straight ahead. Typically, the distance from the eye to the camera lens is 9 mm. OCT is carried out by scanning, this process is controlled using a control panel, which consists of six groups of buttons and manipulators with different functions.
After scanning, the images are aligned and cleared of noise. Based on the data obtained, tissue measurements and optical density analysis are carried out. Quantitative measurements can be compared with normal values that have been stored in the computer's memory.
How should a patient prepare?
No special preparation is required for computed tomography of the eyes. However, in order to obtain a better image, doctors recommend dilating the pupil. To do this, a special medication is instilled into the patient's eyes.
After diagnosis with contrast, redness and itching in the eyes may appear.
In some cases, MSCT of the eye orbit with contrast is required. For this procedure, an iodine-containing substance is used. Before such a study, the patient should not eat for four hours. If you have an allergy (even to anything), you should definitely inform your doctor about this, since sometimes performing a procedure with contrast causes a negative reaction in the form of redness and itching.
Interpretation
The diagnosis is always based on expert analysis of scanograms obtained from OCT. In this case, the doctor pays attention to the morphological indicators of tissues (the relationship of layers and sections, changes in the external contour, relationship with neighboring tissue structures), changes in light reflectivity (decrease or increase in transparency, the presence of pathological inclusions). With quantitative data analysis, you can see changes in the thickness of the cell layer (thinning, thickening), the volume of the structure being studied, and also obtain a surface map.
OCT for glaucoma
The first sign of the pathological effect of increased intraocular pressure (IOP) in glaucoma is the measurement of the optic nerve head, which can be diagnosed using this technique.
At the moment, optical coherence tomography is the “gold standard” in the diagnosis of glaucoma, because allows you to establish a diagnosis with much greater accuracy than using tonometry, tonography, determination of visual fields, etc.
Other eye structures and diseases for which the study is used:
Corneal tomography
With OCT of the cornea, it is important to correctly locate all structural abnormalities, as well as calculate their indicators. This will help you choose the optimal treatment tactics or evaluate its effectiveness. In some situations, only optical coherence tomography can calculate corneal thickness. It is very important that the technique is non-contact and does not affect the damaged corneal layer.
Tomography of the iris
In this case, the doctor can examine the anterior transparent layer, the pigment epithelium and the stromal substance itself. All these layers have different reflectivity, which is associated with different concentrations of pigment in their cells. If the iris is light, then the greatest degree of reflection occurs from the posterior layer of the pigment epithelium (while the two anterior layers are not sufficiently visualized). With early pathological processes in the iris, which can be detected by OCT, a number of eye diseases are diagnosed (pigment dispersion syndrome, essential mesodermal dystrophy, pseudoexfoliation syndrome, Frank-Kamenetsky syndrome.
Retinal tomography
Optical coherence tomography of a healthy eye can reveal the correct profile of the macula, in the center of which there is a depression. The layers of the retina vary depending on their ability to reflect light rays, they do not have focal changes and are uniform in size. The layer of nerve fibers and pigment epithelium are among the layers with high light reflectivity, the plexiform and nuclear layers are in the middle, the photoreceptor layer is almost transparent. Along the outer edge of the retina there is a bright red, highly photoreflective layer, the thickness of which is 70 microns. It consists of choriocapillaris and retinal pigment epithelium. The dark stripe next to the red one is the photoreceptor layer.
There is also a bright red line on the inner surface, corresponding to nerve fibers. Due to the presence of such sharp staining of the layers of the retina, the doctor can easily measure their thickness. In the area of the central foveal fossa, the thickness of the retina is about 162 µm, and at the edge of the fovea - 235 µm.
Idiopathic macular holes
For idiopathic retinal defects in the macula area, which arise for no apparent reason in old age, OCT can identify signs of the disease at all stages of the clinical course, as well as determine treatment tactics and monitor it. In the initial manifestations (pre-rupture), tomograms show foveal detachment in the area of the neuroepithelium, which is associated with vitreofoveolar traction. If there is a lamellar break, then the tomogram shows a defect in the inner surface of the retina, but the photoreceptor layer is preserved. With a through rupture, the defect extends to the entire thickness of the retina.
Degenerative changes
Optical coherence tomography around the break zone can reveal degenerative transformations of the retina. The formation of vitreomacular traction is also an important prognostic symptom. Analyzing the tomogram, it is necessary to measure the thickness of the retina in the macula area, the diameters of the gap (minimum and maximum), the size of intraretinal cysts, the thickness of the edematous tissue along the edge of the gap. It is also important to pay attention to the degree of tissue degeneration near the rupture, which is manifested by compaction and red coloring on the image.
Age-related macular degeneration
This group of chronic diseases of unknown etiology manifests itself as degenerative disorders of the retina in elderly patients. OCT can examine changes in structures in the posterior pole of the eye. The doctor measures the thickness of the retina to evaluate the effectiveness of treatment.
Diabetic macular edema
The disease develops against the background of diabetes mellitus and is quite severe. Tomograms measure the thickness of the retina, assess the degree of tissue degeneration, intraretinal inclusions and the condition of the vitreomacular space.
Optic nerve
Optical coherence tomography can visualize nerve fibers with high accuracy and measure the thickness of the optic nerve. This indicator correlates with its function, including the preservation of the visual field. Nerve fibers have a high degree of backscattering, so they contrast well with the intermediate layers of the retina. Axons are traditionally oriented perpendicular to the beam of light from the tomograph.
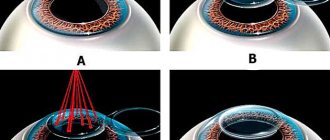
Radial or circumferential scans are used to examine the optic disc. In the first case, the image of the disc is presented in cross section, this makes it possible to evaluate the excavation, the thickness of the nerve fibers in the peripapillary region, the angle of inclination of the fibers in relation to the retina and the surface of the disc.
To obtain three-dimensional images of the optic nerve head, it is necessary to conduct a series of surveys in different meridians. In this case, it is possible to evaluate the structure of the fibers in different parts of the disc. This tomogram looks like a flat linear image. Typically, the thickness of the retina and fibers is calculated by a computer and presented on the screen as an average value for the entire study area, just a quadrant, an hour, or for each scan separately. All these quantitative indicators are compared with normal values, as well as with values obtained in previous studies. In this case, diffuse atrophy and local defects can be detected, which is used to diagnose neurodegenerative diseases.
Stagnant disk
A congested disc indicates increased intracranial pressure. With OCT, it is quite easy to identify signs of a stagnant disc, measure its parameters and evaluate changes in dynamics. To do this, the level of light reflection of tissues is examined, since it changes depending on their hydration and degeneration.
Optic fossa
This congenital malformation most often leads to retinal separation in the macular zone (schisis). OCT clearly identifies optic disc defects, retinal dissection and other changes occurring in the macula area.
Retinitis pigmentosa
Tapetoretinal abiotrophy is a hereditary disease with a progressive course. In this case, the photoreceptor layer is damaged. OCT is used to assess the chorioretinal complex and determine the severity of the disease. Tomograms measure the thickness of the photoreceptor and neuroglial layers and the diameter of the nerve fibers, and evaluate the transparency of the retinal tissue. Even with a latent course of retinitis pigmentosa, when there are no clinical symptoms of the disease, OCT can reveal characteristic changes represented by a decrease in the thickness of the photoreceptor layer, a decrease in the transparency of this layer, as well as the appearance of signs of increased metabolism of the pigment epithelium. When comparing tomograms, pathological changes can be monitored. Also, OCT is used to diagnose the non-pigmented form of retinitis pigmentosa in children, when it is not possible to conduct functional examination methods.
Spectral optical coherence tomography: principles and capabilities of the method
and possibilities (Literary review) AV Svirin, Yu.I. Kiiko*, BV Obruch, AV Bogomolov Russian State Medical University of Roszdrav, *FGU VCGPH of Roszdrav, Moscow
Authors discuss principles, diagnostic possibilities and types of new examination method – spectral optic coherent tomography which information value exceeds the OCT's.
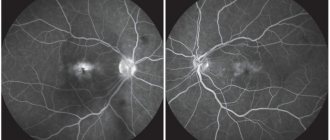
Optical coherence tomography (OCT) is widely used in modern medicine. This is a non-invasive and highly accurate research method with which it has become possible to obtain images of a cross-section of the tissue under study in vivo. OCT was developed at the Massachusetts Institute of Technology in the late 1980s. OCT has found application in many branches of medicine - in gastroenterology, cardiology, urology, dermatology, dentistry. However, the new technique has gained the greatest popularity in diagnosing eye diseases. The most famous device implementing OCT technology in ophthalmology – Stratus OCT (Carl Zeiss Meditec) has currently been sold in quantities exceeding 6 thousand copies. There are more than a thousand articles and scientific papers in the world devoted to the use of OCT in the diagnosis of eye diseases. Principles of the method The essence of OCT is to measure the delay time of a light beam reflected from the tissue being examined. Since modern equipment does not allow direct measurement of this parameter over such small spatial intervals, OCT operation is based on the principles of light interferometry. Until recently, the basis of all coherence tomographs was the Michelson interferometer (time-domain OCT). The light source in it is a superluminescent diode, which makes it possible to obtain a beam of low coherence. Using a splitter, the light beam is split into two equal parts, one of which is directed to the structure under study, the second to a movable mirror (reference arm). By moving the working part of the device, the researcher ensures that the distance to both objects is the same. After this, the reflected rays are summed, which causes an interference effect recorded by the photodetector. The resulting amplitude of the interfering light wave characterizes the reflectivity of a specific point of the object under study. Then the reference arm is shifted and the next point is examined. As a result, a one-dimensional A-scan (axial scan) is formed. The two-dimensional image obtained by summing up several A-scans, by analogy with ultrasound, is called a B-scan. The distance between the A-scan points determines the longitudinal (axial) resolution, and the distance between adjacent A-scans determines the transverse resolution. The main factor limiting the capabilities of Time-domain OCT is the presence of a mechanical element of the system - a movable mirror of the reference arm. The axial resolution and scanning time directly depend on the accuracy and speed of its displacement. The maximum longitudinal resolution of OCT obtained in laboratory conditions is 2–3 μm. This result was achieved on stationary objects using a femtosecond laser as a light source. However, a commercial version of this system was not implemented due to its high cost. The maximum resolution of Time-domain OCT in the clinic is presented in the latest modification of Stratus OCT and is 8–10 µm at a scanning speed of 400 A-scans per second. A standard study, consisting of 512 A-scans, thus takes more than 1 second. Spectral OCT A radical change in the technology of optical coherence tomography occurred with the introduction into practice of spectral interferometers using the Fourier transform (spectral/Fourier domain). Their difference from the Michelson interferometer is the presence of a spectrometer and a high-speed CCD camera (CCD - charge-coupled device, the Russian-language analogue of the term - CCD (charge-coupled device). The light source is a broadband superluminescent diode, which makes it possible to obtain a low-coherence beam containing several wavelengths. How and in time-domain OCT, the light pulse is divided into two equal parts, one of which is reflected from a fixed reference arm (mirror), the second from the object under study.Then the signals are summed, and the interfering light beam is decomposed into component parts of the spectrum, which are simultaneously recorded CCD camera. The resulting interference spectrum consists of a set of light waves reflected from sections of the object under study at different depths. Then, from the resulting data array, frequency components are extracted using a mathematical Fourier transform, from which an A-scan is formed. Thus, obtaining a linear scan does not occur by sequentially measuring the reflective properties of each individual point in space, but simultaneously. The scanning depth is equal to the coherence zone. This research principle makes it possible to overcome the limiting factors associated with the speed and accuracy of movement of the mechanical parts of the interferometer, since the reference arm remains stationary during the study. The scanning speed of spectral OCT depends on the speed of the CCD camera and the mathematical converter, and the axial resolution depends on the sensitivity of the spectrometer. The lateral resolution of all types of OCT is limited by aberrations of the optical system of the eye. Thanks to the principle of its operation, spectral OCT allows performing more than 25 thousand linear scans per second, exceeding previous generation optical tomographs by more than 60 times in this parameter (some models - 120 times). Axial resolution is in the range of 3–8 µm, transverse – 10–15 µm. At the time of writing, 5 models of spectral optical coherence tomographs with the ability to study the posterior segment of the eye were presented on the world market: 1) RTVue-100 from Optovue (USA) - made it possible to combine in one device the ability to study both the anterior and posterior segments of the eyeball; 2) 3D OCT–1000 (Topcon) – has the functions of a fundus camera and comparison of a fundus photograph with an OCT image; 3) CIRRUS HD OCT (Carl Zeiss); 4) Soct Copernicus and Soct Copernicus HR jointly produced by Reichert (USA) – Optopol (Poland). Soct Copernicus HR currently has the highest declared scanning speed (55,000 A scans per second) and axial resolution (3 µm). Also, under the Soct brand, spectral OCT has been developed for studying the anterior segment of the eye; 5) Spectralis HRA+OCT (Heidelberg Engineering) – OCT attachment for the HRA laser scanning angiograph. The first commercial device to implement the capabilities of spectral OCT of the eye was the RTVu-100 from Optovue (USA). The company announced the start of its production at the end of 2006. It is this device that we use in our clinic, therefore, in the future, the main technical characteristics and examination protocols are given based on the capabilities of the RTVu-100. Improved diagnostic capabilities A significant increase in the speed and accuracy of the method has qualitatively changed the role of optical coherence tomography in the diagnosis of eye diseases. To understand the full significance of these changes, let us consider spectral OCT from the point of view of its clinical application. One of the most important problems that arise when using previous generation tomographs is the sensitivity of the method to micromovements of the eyeball. The greatest errors are caused by so-called microsaccades - involuntary rapid movements with an amplitude of 2-10 arcmin and an interval of 100 ms. One standard Stratus OCT study (512 A-scans) lasts 1.28 seconds. – during this time the eyeball changes its position 10–14 times. This effect has a negative impact on the final tomogram. Graphical anti-aliasing methods are used to neutralize emerging artifacts. They effectively straighten the image, but can hide local changes, which introduces additional difficulties in interpreting the results. Spectral coherence tomographs, in contrast to time-domain OCT, make it possible to obtain a standard linear profile (1024 A-scans) in an average of 0.04 seconds. During this period of time, the eyeball does not have time to make significant movements, which means that the final B-scan corresponds as closely as possible to the true structure of the object being studied. High resolution allows clear identification of all layers of the retina and the inner layers of the choroid. The diagnostic search is carried out at the level of individual structures and groups of cells (Fig. 1). Clear visualization of the “pigment epithelium – photoreceptor layer – external limiting membrane” complex contributes to the early detection of retinochoroidal pathology. As an example, Figure 2 shows OCT of the peripheral retina of a patient suffering from Stargardt's dystrophy. The high resolution of the method makes it possible to identify pathological changes in the layer of the outer segments of photoreceptors. Three-dimensional visualization However, the main difference between spectral OCT was the possibility of three-dimensional visualization of an object (a section of the retina, the head of the optic nerve, the cornea, etc.). High scanning speed allows you to perform a large number of A-scans (more than 50,000) of a tissue area of a fixed area in 1–2 s. Based on this data, the software reconstructs the three-dimensional structure of the object. The resulting 3D image allows you to evaluate the surface profile of the structure under study and its internal topography. It is possible to clearly visualize the boundaries of pathological formations and monitor their dynamics. This function is also indispensable in searching for small changes, the probability of which being included in a single linear scan is low. Figure 3 demonstrates the three-dimensional structure of the central retina of a patient with choroidal neovascularization. A 3D tomogram allows you to assess the involvement of the foveola in the pathological process and track the dynamics of changes. A three-dimensional model of the optic nerve head (ONH) opens up new possibilities in assessing the excavation profile in glaucoma (Fig. 4). RTVu-100 allows you to perform morphometry of the ONH, similar in the structure of the data obtained to HRT. In this case, the boundaries of the optic nerve head are determined on the basis of a 3D image, which makes it possible to draw its contour based on the structural features of the optic disc. Mapping Features The ability to study retinal thickness and layers in a specific area was first implemented in Stratus OCT. The result of the standard protocol is a map that represents the results obtained graphically and in absolute values. Mapping methods have found wide application in both practical and research work. Spectral optical tomography provides new opportunities for mapping ocular structures. First of all, high scanning speed increases their accuracy, since there are a larger number of A-scans per unit area. In addition, the standard research protocol takes no more than 1 second, therefore, movements of the eyeball have minimal impact on the final result. High resolution allows you to clearly identify the boundaries between the layers of the retina in automatic mode. As a result, it becomes possible to obtain not only a map of the thickness of the retina, but also its individual layers (layer of ganglion cells and nerve fibers, photoreceptor cells, pigment epithelium). Figure 5-1 shows a map of retinal pigment epithelium elevation in a patient with newly diagnosed AMD. Linear scans of the central zone of the retina revealed no pathological changes. However, using paracentral mapping, areas of local elevation of the pigment epithelium were discovered. A targeted line scan revealed drusen located at the periphery (Fig. 5-2). A map of the thickness of the layer of nerve fibers and retinal ganglion cells expands the capabilities of the device in diagnosing optic nerve atrophies, including glaucomatous origin. It is possible to draw a parallel in the structure of the results obtained with polarimetric methods (although in the latter only the thickness of the layer of nerve fibers is determined without taking into account the layer of ganglion cells). Conclusion Unfortunately, within the framework of one article it is impossible to describe all the new opportunities that spectral optical coherence tomography provides the researcher. It is still necessary to develop a set of diagnostic criteria for the main groups of diseases of the posterior segment of the eye, to evaluate the accuracy of the results obtained in relation to devices using other physical principles (scanning laser ophthalmoscopes, laser polarimeters, etc.). However, it can already be argued that spectral optical coherence tomography is a qualitatively new method for diagnosing eye diseases. Its information content significantly exceeds the previous generation OCT due to its increased resolution and high research speed. The method allows you to obtain a comprehensive picture of the ultrastructure of an arbitrary area of the retina and the head of the optic nerve. The multidirectionality of the results obtained, wide possibilities for diagnosis and dynamic observation of various eye diseases make spectral optical coherence tomography one of the most accurate and universal methods of morphological research in ophthalmology.
Operational characteristics
The source of the light signal in an optical coherence tomograph is a superluminescent diode (wavelength 820 nm is used to study the retina, 1310 nm - for the anterior segment of the eye). The signal type in OCT is optical scattering from the tissue. The size of the image field depends on the area of study: for the posterior segment it is 30 by 22 mm, for the anterior segment it is 10 by 16 µm. The resolution of the method for longitudinal structures reaches 10 µm, and for transverse structures – 20 µm. The scanning speed of OCT reaches 500 slices per second.